Overview

One Map Instead of Six Portals.

In development

Pan the map and it asks LA County's parcel service what's in view, then pins each parcel with what the public record knows: lot size, building size, year built, unit count, assessed land value versus building value, and how long it has been in the same hands. Filters narrow by property type, by how much of the lot the building covers, by build year and by ownership tenure. An address search geocodes the text (turns it into coordinates) and flies there. Anything worth revisiting goes on a saved list held on the server.
The Hard Part

Public Data Doesn't Come With a Manual

The map is the easy part. Each government endpoint speaks its own dialect, and most are barely documented.

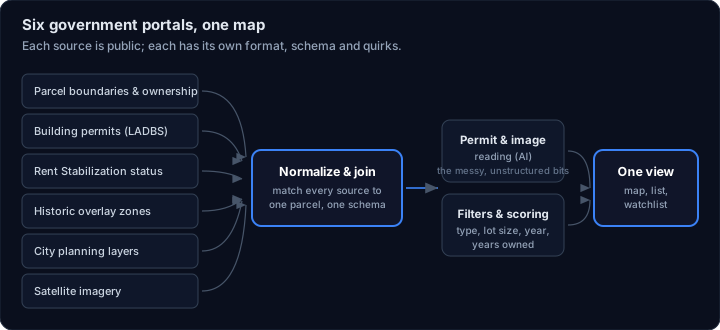
Diagram: six public data sources are normalized and joined onto one parcel, passed through AI reading and scoring filters, and shown as one map, list and watchlist

Reverse-Engineering the Sources

The repo carries throwaway probe scripts whose only job was asking an endpoint what it actually contains: list the field names, dump five sample rows, search the city data catalogue by keyword. That's how you find out ownership tenure hides in a field called Roll_LandBaseYear. The sources span county parcels, City Planning zoning, rent-stabilization and historic-overlay layers, census tracts and permits.

Missing Isn't Zero

Government records are full of blanks. Treat a blank as a value and it quietly poisons everything downstream. An unknown build year stays empty rather than becoming 0, because 0 scores as "extremely old". A zoning lookup that hasn't run is empty too, so an unchecked parcel sits neutral.

One copy of the rules

The scoring logic had been hand-copied into three places: the live ranking, the backtest and the tests. They drifted apart, each missing a rule the others had. Obviously-bad parcels ranked high and the validation number meant nothing. It's now one module every caller imports.

Scoring

How the Score Is Built

Parcels are ranked by redevelopment potential: how much a plot resembles ones that were historically rebuilt. A hand-tuned points system did this first; it's now a fitted statistical model. The point of the rewrite was being able to check it.

Fitted, Not Guessed

Nineteen inputs, fitted against recorded outcomes rather than intuition: footprint as a share of the lot, age, unit count, land value versus building value, the gap between the units zoning allows and the units actually there, historic overlays, neighbourhood indicators. Missing inputs fall back to the training average. On top of the fitted score sits a small capped adjustment for live signals the training data can't calibrate: recent purchase, rent-stabilization registration, a filed tenant buyout. The interface lists which features moved a score, so it can be read and not just trusted.

Checked Against a Control Group

A backtest button scores parcels with recent demolition permits and a random sample of comparable parcels through the identical path, then reports both averages and their counts. An average with no control group says nothing; that was the earlier version's flaw. Samples are small: a sanity check, not a published result.

The Build

AI Only Where Rules Fall Down

Most of the tool is arithmetic on public records. Two jobs resist that. A third is still a stub.

Working

Reading Permits

Permit descriptions are free text, written by whoever filed them. The app pulls an address's recent permits from the city dataset and asks Claude to sort them into demolition, remodel or maintenance, in a fixed structure with a one-line reason. If the call fails it answers neutrally rather than guessing.

Working

Listing Check

For the top ten by score, the server fetches public web search results for the address and asks whether anything reads like an active rental listing. Results stream back one property at a time, so the list fills in as they land.

Not built yet

Imagery Analysis

The front end already posts visible parcels to a vision endpoint, but that endpoint only acknowledges them; nothing reads the imagery yet. A separate prototype crops an aerial tile to a lot and asks a vision model for roof coverage. It isn't wired in.

One Container, No GPU

One Express process serves both the API and the built React front end, shipped as a single Docker service behind Caddy, which terminates HTTPS and provisions its own Let's Encrypt certificate. A 1 GB droplet is enough because nothing runs a model locally; the AI calls go to the Claude API.

Login and API Keys

Everything sits behind a login. The first run creates the owner account, after which the setup route refuses to mint more. Passwords are hashed with a per-user random salt and compared in constant time. The session cookie is signed and HTTP-only, and repeated failures get throttled. The Anthropic key is set in Settings, not baked into the image.

Honest limits

It works in Los Angeles only; every parcel, zoning and overlay source is an LA City or LA County dataset. It reads public records and public search results only. It's unfinished: the imagery feature is a stub and the README is still the project template. It is not investment advice; the score says nothing about prices or returns.